Q4 2021 Market Review and Commentary
Market Review*
- Equity markets generally outperformed fixed-incom
- e markets with the S&P 500 falling 4.60% (including dividends) and the Barclay’s Capital U.S. Aggregate Bond index falling 5.93%.
- Small caps underperformed large cap stocks (S&P 500) as the Russell 2000 small cap stock index returned -7.53%.
- Value outperformed Growth during the quarter (as determined by the S&P 1500 broad market index which includes large, mid, and small capitalization stocks).
- International or developed, non-U.S. equity markets underperformedS. markets in U.S. dollars (MSCI EAFE**: -5.79%) and outperformed in local currency terms (-3.60%).
- The MSCI Emerging Markets Index underperformed developed, non-U.S. equity markets (international) in both U.S. dollar (-6.92%) and local currency terms (-6.06%).
- S. market sectors were mostly negative during the quarter. Energy stocks led all other sectors by a wide margin during the quarter (+39.03%). Communications services (-11.92%), consumer discretionary (-9.03%), and technology (-8.36%) stocks were notable given their weakness.
- High yield bonds fell69% during the quarter. The U.S. corporate bond sector decreased 7.30% during the quarter. 10-Year U.S. Treasury yields climbed slightly from 1.44% at the beginning of the quarter (and year) to 2.36% currently.
- The U.S. dollar rose versus the Japanese Yen (+5.40%), the Euro (+2.16%), and the British Pound (+2.79%) during the quarter.
* Unless otherwise noted, performances stated above reflect data provided by Standard and Poor’s, Russell Investments, MSCI, and Barclay’s Capital.
** The MSCI EAFE Index is a large capitalization, developed market benchmark that tracks non-U.S. or international equity markets.
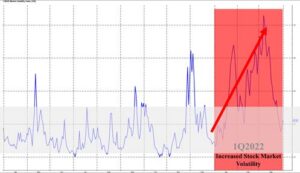
Volatile Start to 2022
U.S. stocks fell from their all-time highs earlier this year as threats, both old and new, helped usher in another period of exceptional stock market volatility. The S&P 500 fell 5.60% for the first three months of the year and briefly landed in correction territory1 before settling at higher levels.
Bond markets, typically seen as a safe haven for investors during global economic threats and/or excessive stock market volatility, did not offer any respite. The Barclay’s Capital U.S. Aggregate Bond index fell 5.93% during the quarter, primarily due to the change in interest rate expectations.
Technology and communication services stocks, some of the best-performing companies over the past several years, were among the worst-performing sectors during the quarter. In contrast, the energy sector offered robust gains as Russia’s invasion of Ukraine and oil supply shortages continued to disrupt at home and abroad. Russia’s invasion of Ukraine contributed to international and emerging market stocks’ poor start to the year.
Concern that the Federal Reserve (the “Fed”) would raise interest rates faster and higher than previously expected (to fight inflation) lead investors to sell growth/technology stocks and fixed income investments2. The threat of COVID also continued to weigh on stocks as new quarantines and lockdowns were reported in China. The unforeseen invasion of Ukraine by Russia (the third-largest oil producer globally) energized oil and commodities markets. The invasion also worsened historically high inflation in the U.S. and abroad.
Recessionary Fears
Meanwhile, recessionary fears also crept higher at quarter’s end as many investors wonder(ed) if the Fed will overreach in its attempt to tame inflation – potentially causing the economy to spiral into recession.
Despite interest rates having only been raised once (last month) by a mere 0.25%, bond markets currently suggest more increases soon, and at higher amounts. The oft-cited yield curve, a graphical representation of interests and their maturities, is believed by many experts to have the power to predict future recessions. Specifically, bonds with two- and ten-year maturities, a commonly watched segment of the yield curve for predictive purposes, recently telegraphed slower growth at a minimum (which is by definition a primary intent of the Fed when it increases interest rates to lower inflation) and a potential recession at worst.
The Yield Curve
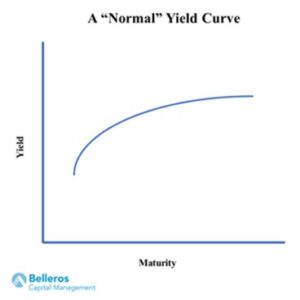
The yield curve is a graphical representation of interest rates and maturities offered on bond or fixed-income contracts of the same credit quality (risk). A common yield curve example exists on the information board posted inside most commercial banks. A typical board might publish the annual percentage rates or “APRs” of certificate of deposits (i.e. CDs) or mortgage loans, alongside their maturities. While there are many bond market variations of the yield curve, investors have traditionally paid most attention to the U.S. Treasury yield curve with particular focus on bonds with maturities between two- and ten-years. The yield curve is normally upward sloping (see chart below), signifying that bond investors typically require or demand greater interest rates over greater investment time periods. A “normal” yield curve is said to reflect a good or stable economy.
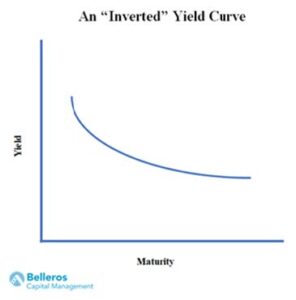
Interest rates on shorter-dated bonds can sometimes rise above those with longer maturities. In such a case, the yield curve is said to be “inverted” as depicted in the chart below. Economists and professional investors alike pay close attention for signs of a potential yield curve inversion as they are reputed to have the ability to predict recessions. A full inversion in the U.S. Treasury bond yield curve (i.e. with maturities between two- and ten-years) has “predicted” each of the past eight recessions in the U.S., going back as far as 1970 and including the Great Recession of 2007.
For What It’s Worth
Despite the seeming correlation between recessions and the yield curve, experience tells us that we need a healthy amount of skepticism. Although each of the past eight recessions were preceded by in inversion of the yield curve described above, not all inversions predict recessions. This is not an exact science. First of all, to this day, there is still substantial disagreement about what is the right yield curve to use for recession prediction purposes. Should U.S. Treasury bonds be used? What segment or maturities along the yield curve should we focus on? Many experts suggest the two- and ten- year segment, but a very convincing minority suggests even shorter maturities.
Yield curves are dynamic and change continuously, so the duration of an inversion may be fleeting. The two- and ten-year maturities of the U.S. Treasury yield curve inverted on April 1, 2022, but quickly normalized in the days that followed. Was this enough time to predict a recession? Should it last for a week, weeks, or months? Even then, there is no clear consensus of when you can expect said recession to appear after the prognosticative signal has been made. Again, many experts suggest a year until a recession is reached after an inversion. But this is not exact either. The 2006 inversion preceded a recessionary environment by 16 months (using official declarations).
Famously (or infamously), the most recent yield curve inversion occurred in 2019 just before the COVID pandemic arrived. Are we to assume that the yield curve predicted COVID? Assuredly not. Irrespective of this, count us as not entirely impressed by yield curves and their predictive powers. As alluded to above, the inverted yield curve is very prone to issuing false signals. And because there hasn’t been one recipe that’s been settled on that guarantees a future recession within a modestly granted time period, the result is a noise. We would expect to see excessive stock market volatility as the market is driven by opposing predictions of how, what, why, and when. If you’ve been keeping tabs on our modus operandi, that is what truly excites us.
We continue to be conflicted regarding potential recessions and all things macro-economic in nature, and their effect on the stock market. While we are cognizant of the pain many investors and households will feel from these threats to our economy and pocketbooks, we also recognize that they are also sources of the volatility we seek to exploit as a part of our long-term investment strategy. We believe we can add value for our clients (over the long-term) through the implementation of our strategy. In this way, we hope to mitigate some of the pain or disruption they may experience elsewhere. And perhaps that is the best way to respond when life hands you a bowl of lemons (in the short-term). Regardless of what may be ahead for the economy and markets, we believe that remaining calm, disciplined, and focused on a long-term investment strategy is the ideal way to ride out market volatility. In this way, we can help you make the lemonade you can savior over the long-term. We wish you all the best during these eventful days. Enjoy spring!
Questions and Consultations
If you have questions or if you’d like to schedule an appointment to discuss your finances, contact us today.
Want more information? Sign up to receive our monthly e-newsletter here.
Partnership Wealth Management is a comprehensive financial services company. We are committed to providing our clients with financial planning and wealth management services to help them make the most of their investments. At Partnership Wealth Management we have a long history of working with the LGBT community. Among our many services, we offer financial planning for gay couples and lesbian couples as well as estate planning for gay couples and lesbian couples. Financial planning is an important part of preparing for the future, contact us today to get started: www.partnershipwm.com.
Disclosures
The commentary presented herein contains the opinions of Bel/eras Capital Management, a OBA of Partnership Wealth Management, LLC. Partnership Wealth Management, LLC is a registered investment advisor. This information should not be relied upon for tax purposes and is based upon sources believed to be reliable. No guarantee is made to the completeness or accuracy of this information.
Bel/eras Capital Management shall not be responsible for any trading decisions, damages, or other losses resulting from, or related to, the information, data, analyses or opinions contained herein or their use, which do not constitute investment advice, are provided as of the date written, are provided solely for informational purposes, and therefore are not an offer to buy or sell a security. Investments in securities are subject to investment risk, including possible loss of principal. Prices of securities may fluctuate from time to time and may even become valueless. This information has not been tailored to suit any individual.
Past performance may not be indicative of future results. Therefore, no current or prospective client should assume that future performance of any specific investment or investment strategy (including the investments and/or investment strategies recommended or undertaken by Bel/eras Capital Management, made reference to directly or indirectly by Belleros Capital Management, or indirectly via a source to an unaffiliated third party), will be profitable or equal the corresponding indicated performance level(s). Different types of investments involve varying degrees of risk, and there can be no assurance that any specific investment will either be suitable or profitable for a client or prospective client’s investment portfolio. Historical performance results for investment indices and/or categories generally do not reflect the deduction of transaction and/or custodial charges, the deduction of an investment management fee, nor the impact of taxes, the payment of which would have the effect of decreasing historical performance results. For Professional Use Only